Easily configurable interactive reports
With exponentially growing gathered data per year, its representation becomes more important than ever to make it comprehensible and interpretable for humans. Datavzrd aims to create a solution for reporting tabular data in a sharable format that is highly customizable and easy to use with simple configuration using the yaml syntax.
Datasets
Organize your datasets in a single place with few lines of code. Use links to connect them and make your reports interactive. Datavzrd supports CSV, TSV, JSON and parquet input files.
datasets:
  table-a:
    path: table-a.csv
    links:
      gene details:
        column: gene
        view: gene-{value}
      gene expression:
        column: gene
        table-row: table-b/gene
Linkouts
Add links to external resources to your reports to provide additional information and context.
Gene:
  link-to-url:
    ncbi:
      url: https://www.ncbi.nlm.nih.gov/gene/{gene}
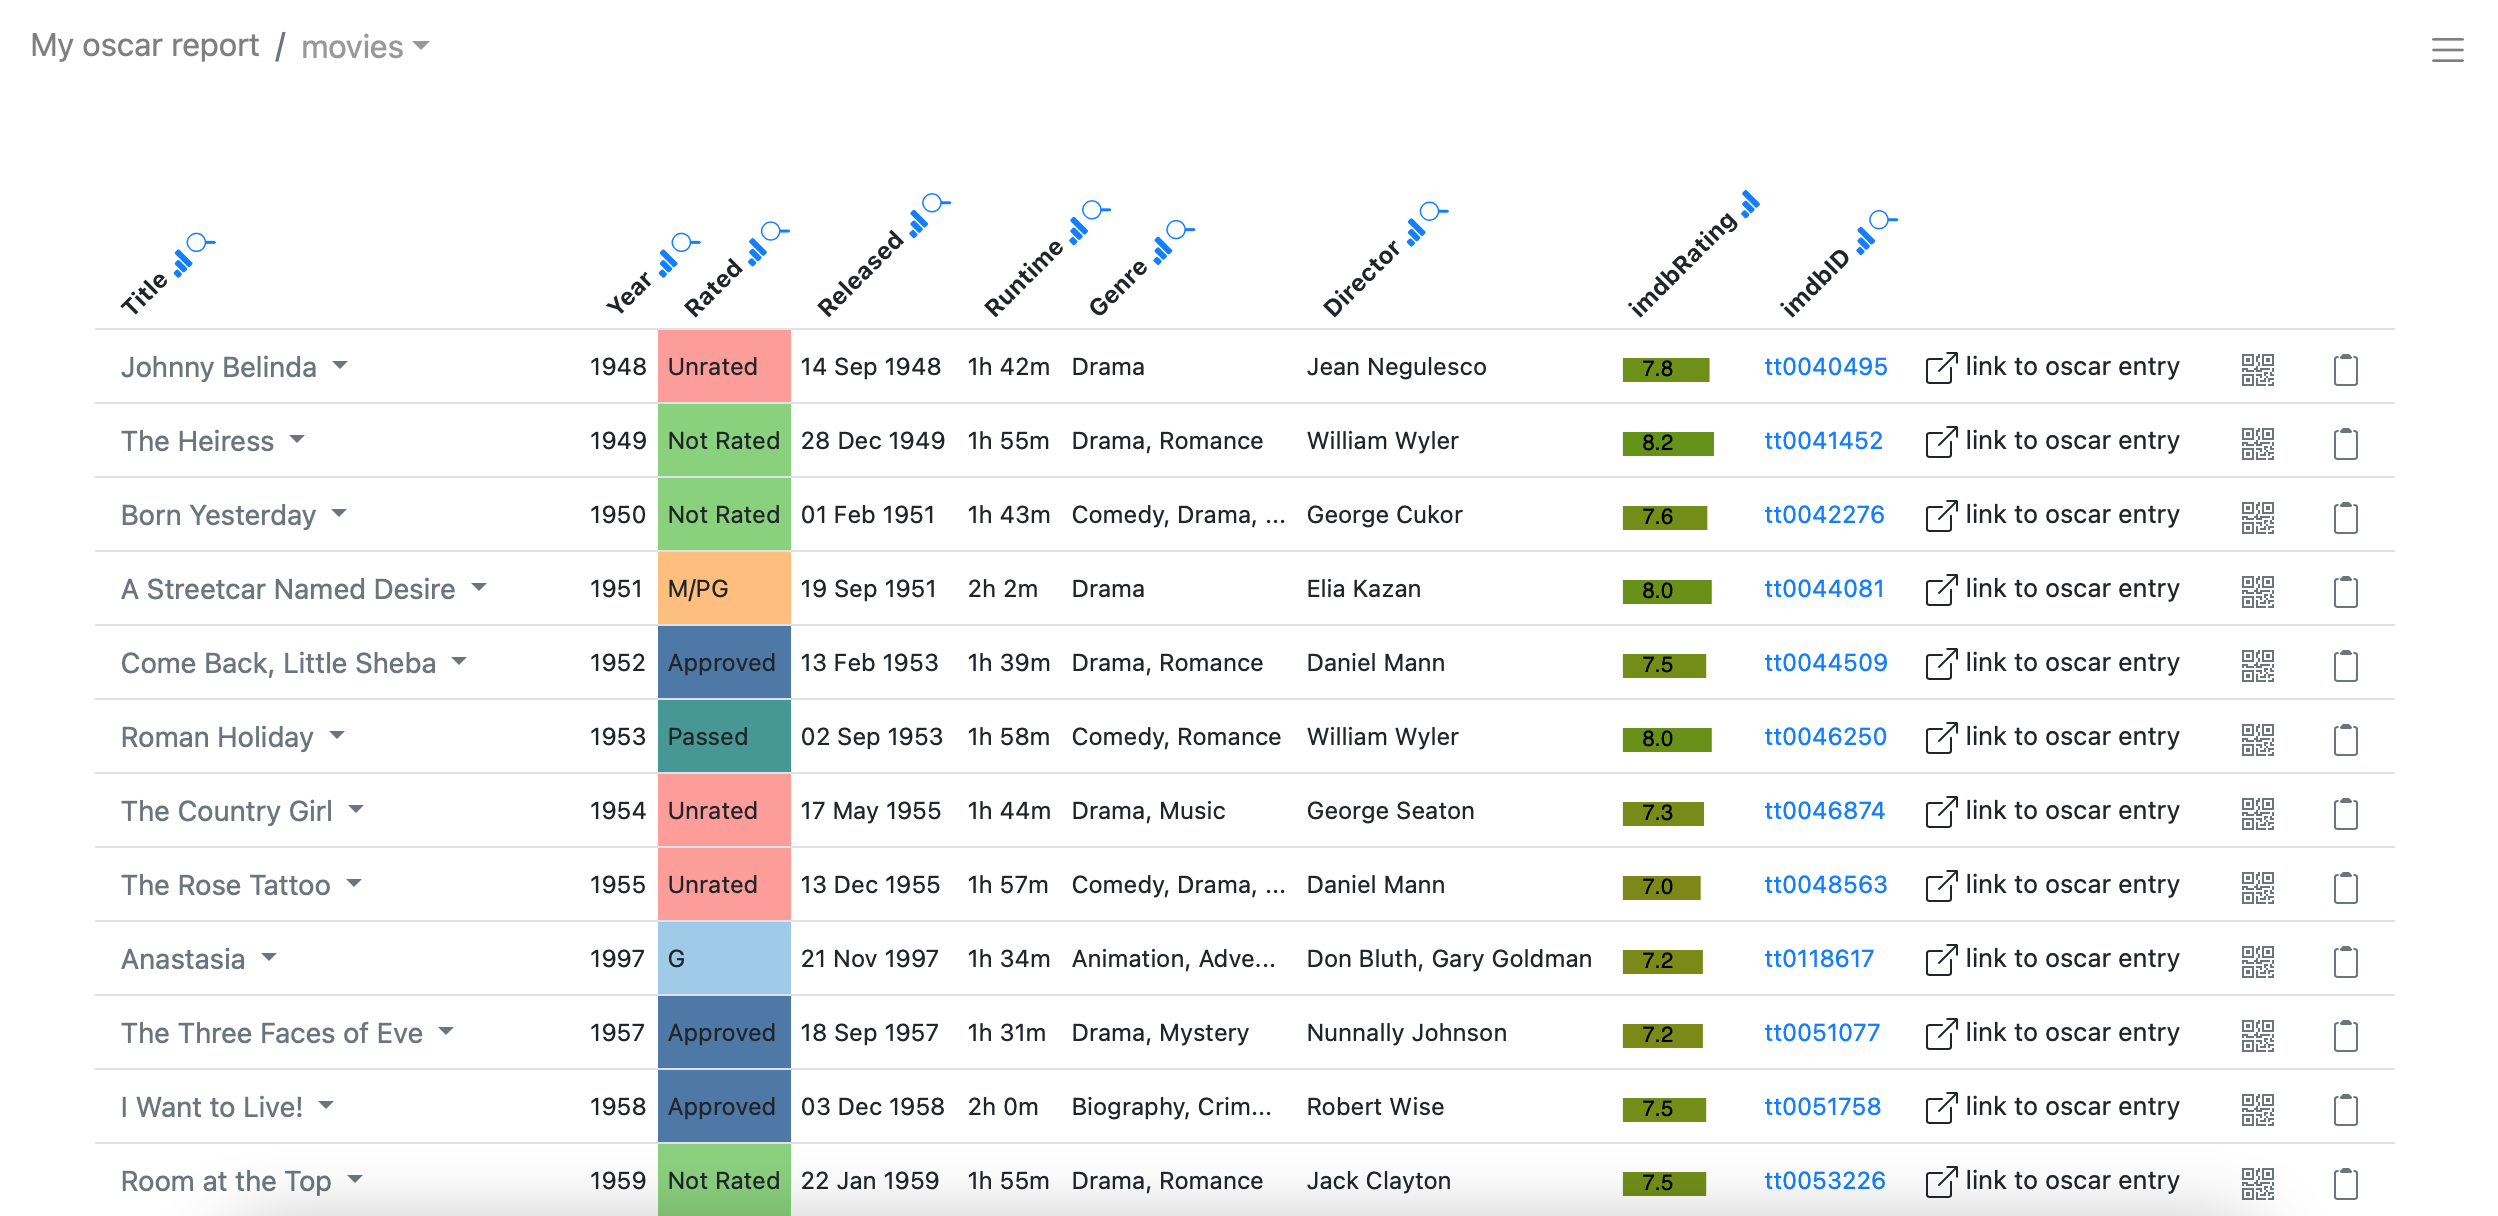
Heatmaps
Datavzrd makes it easy to create heatmaps from tabular data. Heatmaps can be used for numerical or categorical data with predefined color schemes or continuous color scales.
Rated:
  plot:
    heatmap:
      scale: ordinal
      color-scheme: tableau20
Plots
Use custom vega-lite json specs to create any plot suitable for your needs or rely on Datavzrds easy to configure plot or bar plots.
age:
  plot:
    ticks:
      scale: linear
      domain:
        - 20
        - 100
Spells
Datavzrd offers so called spells to simplify the process of creating reports by allowing users to define common configurations in a modular way.
render-table:
  columns:
    p-value:
      spell:
        url: v1.0.0/stats/p-value
        with:
          significance_threshold: 0.05
Authors and Contributors ⓘ
- Felix Wiegand
- Johannes Köster
- florianfelix
- Can Özkan
- David Laehnemann
- Loren Van Spronsen
- Pranesh Nikhar
- Till Hartmann
Groups, Institutes, Companies, and Organizations ⓘ
- Universität Duisburg-Essen
- University of Duisburg-Essen
- @bihealth